
Astronomers at the University of Zürich, the ETH Zurich, the University of Leicester and NAOC Beijing have found large amounts of invisible "dark matter" near the Sun. Their results are consistent with the theory that the Milky Way Galaxy is surrounded by a massive "halo" of dark matter, but this is the first study of its kind to use a method rigorously tested against mock data from high quality simulations. The authors also find tantalising hints of a new dark matter component in our Galaxy. The team's results will be published in the journal Monthly Notices of the Royal Astronomical Society.
Dark matter was first proposed by the Swiss astronomer Fritz Zwicky in the 1930s. He found that clusters of galaxies were filled with a mysterious dark matter that kept them from flying apart. At nearly the same time, Jan Oort in the Netherlands discovered that the density of matter near the Sun was nearly twice what could be explained by the presence of stars and gas alone. In the intervening decades, astronomers developed a theory of dark matter and structure formation that explains the properties of clusters and galaxies in the Universe, but the amount of dark matter in the solar neighbourhood has remained more mysterious. For decades after Oort's measurement, studies found 3-6 times more dark matter than expected. Then last year new data and a new method claimed far less than expected. The community was left puzzled, generally believing that the observations and analyses simply weren't sensitive enough to perform a reliable measurement.
In this latest study, the authors are much more confident in their measurement and its uncertainties. This is because they used a state-of-the-art simulation of our Galaxy to test their mass-measuring technique before applying it to real data. This threw up a number of surprises. They found that standard techniques used over the past 20 years were biased, always tending to underestimate the amount of dark matter. They then devised a new unbiased technique that recovered the correct answer from the simulated data. Applying their technique to the positions and velocities of thousands of orange K dwarf stars near the Sun, they obtained a new measure of the local dark matter density.
Lead author Silvia Garbari says: "We are 99% confident that there is dark matter near the Sun. In fact, our favoured dark matter density is a little high. There is a 10% chance that this is merely a statistical fluke. But with 90% confidence, we find more dark matter than expected. If future data confirms this high value, the implications are exciting. It could be the first evidence for a "disc" of dark matter in our Galaxy, as recently predicted by theory and numerical simulations of galaxy formation. Or it could be that the dark matter halo of our Galaxy is squashed, boosting the local dark matter density."
Many physicists are placing their bets on dark matter being a new fundamental particle that interacts only very weakly with normal matter -- but strongly enough to be detected in experiments deep underground where confusing cosmic ray events are screened by over a kilometre of solid rock.
An accurate measure of the local dark matter density is vital for such experiments as co-author Prof. George Lake explains: "If dark matter is a fundamental particle, billions of these particles will have passed through your body by the time your finish reading this article. Experimental physicists hope to capture just a few of these particles each year in experiments like XENON and CDMS currently in operation. Knowing the local properties of dark matter is the key to revealing just what kind of particle it consists of."
Science contacts
Silvia Garbari
Tel: +41 76 211 05 12
silvia@physik.uzh.ch
Prof. Justin Read
Tel: +41 76 200 5394
justin.read@phys.ethz.ch
Media contact
Robert Massey
Royal Astronomical Society
Mob: +44 (0)794 124 8035
rm@ras.org.uk
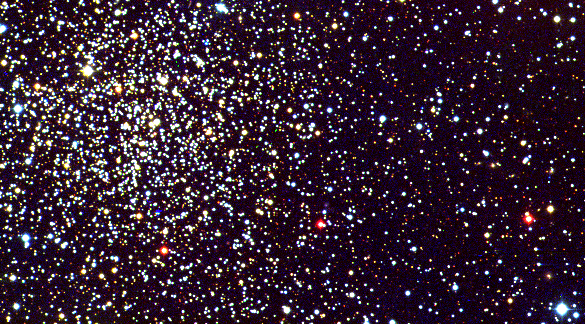
Image and caption
Caption: The high resolution simulation of the Milky Way used to test the mass-measuring technique. Credit: Dr A. Hobbs
Further information
The new work appears in: "A new determination of the local dark matter density from the kinematics of K dwarfs", Monthly Notices of the Royal Astronomical Society, in press. A preprint of the paper is available from http://arxiv.org/pdf/1206.0015v2.pdf
Notes for editors
The Royal Astronomical Society (RAS, www.ras.org.uk), founded in 1820, encourages and promotes the study of astronomy, solar-system science, geophysics and closely related branches of science. The RAS organizes scientific meetings, publishes international research and review journals, recognizes outstanding achievements by the award of medals and prizes, maintains an extensive library, supports education through grants and outreach activities and represents UK astronomy nationally and internationally. Its more than 3500 members (Fellows), a third based overseas, include scientific researchers in universities, observatories and laboratories as well as historians of astronomy and others.
Dark matter was first proposed by the Swiss astronomer Fritz Zwicky in the 1930s. He found that clusters of galaxies were filled with a mysterious dark matter that kept them from flying apart. At nearly the same time, Jan Oort in the Netherlands discovered that the density of matter near the Sun was nearly twice what could be explained by the presence of stars and gas alone. In the intervening decades, astronomers developed a theory of dark matter and structure formation that explains the properties of clusters and galaxies in the Universe, but the amount of dark matter in the solar neighbourhood has remained more mysterious. For decades after Oort's measurement, studies found 3-6 times more dark matter than expected. Then last year new data and a new method claimed far less than expected. The community was left puzzled, generally believing that the observations and analyses simply weren't sensitive enough to perform a reliable measurement.
In this latest study, the authors are much more confident in their measurement and its uncertainties. This is because they used a state-of-the-art simulation of our Galaxy to test their mass-measuring technique before applying it to real data. This threw up a number of surprises. They found that standard techniques used over the past 20 years were biased, always tending to underestimate the amount of dark matter. They then devised a new unbiased technique that recovered the correct answer from the simulated data. Applying their technique to the positions and velocities of thousands of orange K dwarf stars near the Sun, they obtained a new measure of the local dark matter density.
Lead author Silvia Garbari says: "We are 99% confident that there is dark matter near the Sun. In fact, our favoured dark matter density is a little high. There is a 10% chance that this is merely a statistical fluke. But with 90% confidence, we find more dark matter than expected. If future data confirms this high value, the implications are exciting. It could be the first evidence for a "disc" of dark matter in our Galaxy, as recently predicted by theory and numerical simulations of galaxy formation. Or it could be that the dark matter halo of our Galaxy is squashed, boosting the local dark matter density."
Many physicists are placing their bets on dark matter being a new fundamental particle that interacts only very weakly with normal matter -- but strongly enough to be detected in experiments deep underground where confusing cosmic ray events are screened by over a kilometre of solid rock.
An accurate measure of the local dark matter density is vital for such experiments as co-author Prof. George Lake explains: "If dark matter is a fundamental particle, billions of these particles will have passed through your body by the time your finish reading this article. Experimental physicists hope to capture just a few of these particles each year in experiments like XENON and CDMS currently in operation. Knowing the local properties of dark matter is the key to revealing just what kind of particle it consists of."
Science contacts
Silvia Garbari
Tel: +41 76 211 05 12
silvia@physik.uzh.ch
Prof. Justin Read
Tel: +41 76 200 5394
justin.read@phys.ethz.ch
Media contact
Robert Massey
Royal Astronomical Society
Mob: +44 (0)794 124 8035
rm@ras.org.uk
Image and caption
An image from the simulation can be downloaded from: http://www.astro.phys.ethz.ch/~jread/Press/mw_hr_00260_disk.jpg
Caption: The high resolution simulation of the Milky Way used to test the mass-measuring technique. Credit: Dr A. Hobbs
Further information
The new work appears in: "A new determination of the local dark matter density from the kinematics of K dwarfs", Monthly Notices of the Royal Astronomical Society, in press. A preprint of the paper is available from http://arxiv.org/pdf/1206.0015v2.pdf
Notes for editors
The Royal Astronomical Society (RAS, www.ras.org.uk), founded in 1820, encourages and promotes the study of astronomy, solar-system science, geophysics and closely related branches of science. The RAS organizes scientific meetings, publishes international research and review journals, recognizes outstanding achievements by the award of medals and prizes, maintains an extensive library, supports education through grants and outreach activities and represents UK astronomy nationally and internationally. Its more than 3500 members (Fellows), a third based overseas, include scientific researchers in universities, observatories and laboratories as well as historians of astronomy and others.


