Showing posts with label Chandra. Show all posts

IGR J11014-6103: Has the Speediest Pulsar Been Found?

Posted by carsimulator on Thursday, June 28, 2012

IGR J11014-6103
Credit: X-ray: NASA/CXC/UC Berkeley/J.Tomsick et al & ESA/XMM-Newton, Optical: DSS; IR: 2MASS/UMass/IPAC-Caltech/NASA/NSF


Researchers using three different telescopes -- NASA's Chandra X-ray Observatory and ESA's XMM-Newton in space, and the Parkes radio telescope in Australia -- may have found the fastest moving pulsar ever seen.


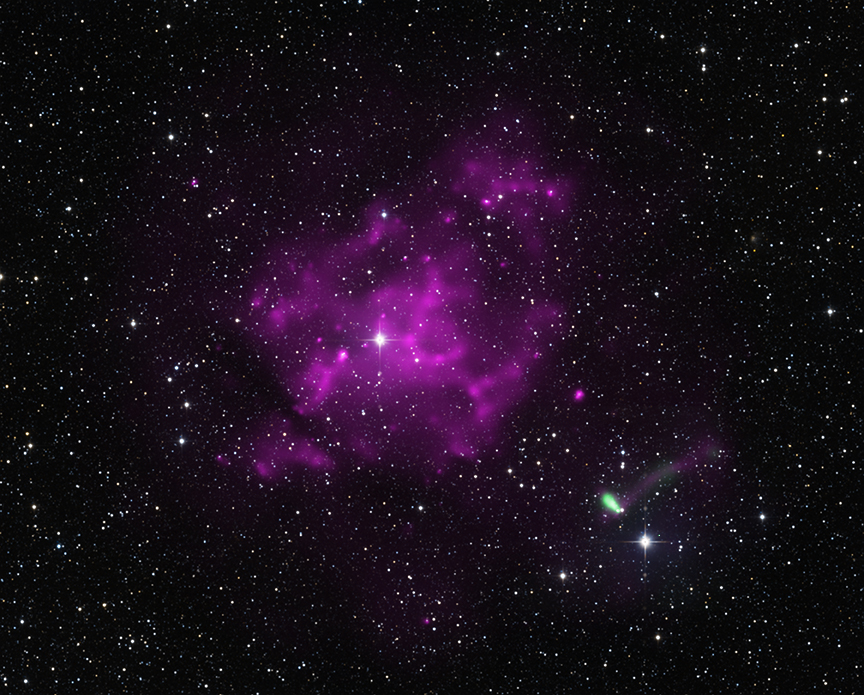
The evidence for this potentially record-breaking speed comes, in part, from the features highlighted in this composite image. X-ray observations from Chandra (green) and XMM-Newton (purple) have been combined with infrared data from the 2MASS project and optical data from the Digitized Sky Survey (colored red, green and blue, but appearing in the image as white).

The large area of diffuse X-rays seen by XMM-Newton was produced when a massive star exploded as a supernova, leaving behind a debris field, or supernova remnant known as SNR MSH 11-16A. Shocks waves from the supernova have heated surrounding gas to several million degrees Kelvin, causing the remnant to glow brightly in X-rays.

The Chandra image shown in the inset ("Chandra Close-up") reveals a comet-shaped X-ray source well outside the boundary of the supernova remnant. This source consists of a point-like object with a long tail trailing behind it for about 3 light years. The bright star nearby and also the one in SNR MSH11-16A are both likely to be foreground stars unrelated to the supernova remnant.

The point-like X-ray source was discovered by the International Gamma-Ray Astrophysics Laboratory, or INTEGRAL, and is called IGR J11014-6103 (or IGR J11014 for short). It may be a rapidly spinning, super-dense star (known as a "pulsar", a type of neutron star) that was ejected during the explosion. If so, it is racing away from the center of the supernova remnant at millions of miles per hour.

The favored interpretation for the tail of X-ray emission is that a pulsar wind nebula, that is, a "wind" of high-energy particles produced by the pulsar, has been swept behind a bow shock created by the pulsar's high speed. (A similar case was seen in another object known as PSR B1957+20 .

The elongated emission is pointing towards the center of MSH 11-61A where the pulsar would have been formed, supporting the idea that the Chandra image is of a pulsar wind nebula and its bow shock. Another interesting feature of the Chandra image, also seen with XMM-Newton, is the faint X-ray tail extending to the top-right. The cause of this feature is unknown, but similar tails have been seen from other pulsars that also do not line up with the pulsar's direction of motion.

Based on earlier observations, astronomers estimate that the age of MSH 11-61A, as it appears in the image, is approximately 15,000 years, and it lies at a distance of about 30,000 light years away from Earth. Combining these values with the distance that the pulsar has appeared to have traveled from the center of the MSH 11-61A, astronomers estimate that IGR J11014 is moving at a speed between 5.4 million and 6.5 million miles per hour.

The only other neutron star associated with a supernova remnant that may rival this in speed is the candidate found in the supernova remnant known as G350.1-0.3. The speed of the neutron star candidate in this system is estimated to lie between 3 and 6 million miles per hour.

The high speeds estimated for both IGR J11014 and the neutron star candidate in G350.1-0.3 are preliminary and need to be confirmed. If they are confirmed, explaining the high speeds of the neutron star presents a severe challenge to existing models for supernova explosions.

One important caveat in the conclusion that IGR J11014 may be the fastest moving pulsar is that pulsations have not been detected in it during a search with the Commonwealth Scientific and Industrial Research Organization (CSIRO) Parkes radio telescope. This non-detection is not surprising for a pulsar located about 30,000 light years away.

However, there are other pieces of evidence that support the pulsar interpretation. First, the lack of detection of a counterpart to the X-ray source in optical or infrared images supports the idea that it is a pulsar, since such objects are very faint at these wavelengths. Also, there are no apparent differences in the brightness of the source between XMM-Newton observations in 2003 and the Chandra observations in 2011, behavior that is expected if IGR J11014 is a pulsar. Finally, the X-ray spectrum of the source, that is, its signature in energy, is similar to what astronomers expect to see for a pulsar.

These results were published in the May 10, 2012 issue of The Astrophysical Journal Letters. The authors were John Tomsick and Arash Bodaghee (University of California, Berkeley), Jerome Rodriguez and Sylvain Chaty (University of Paris, CEA Saclay), Fernando Camilo (Columbia University), Francesca Fornasini (UC Berkeley), and Farhid Rahoui (Harvard-Smithsonian Center for Astrophysics).

NASA's Marshall Space Flight Center in Huntsville, Ala., manages the Chandra program for NASA's Science Mission Directorate in Washington. The Smithsonian Astrophysical Observatory controls Chandra's science and flight operations from Cambridge, Mass.

Fast Facts for IGR J11014-6103:

Scale: 1 degree across (~576 light years)
Category: Supernovas & Supernova Remnants, Neutron Stars/X-ray Binaries
Coordinates (J2000): RA 11h 01m 22.08s | Dec -61° 03' 25.20"
Constellation: Carina
Observation Date: 6 Sep 2011
Observation Time: 1 hours 23 min.
Obs. ID: 12420
Color Code: X-ray-Chandra: (Green) X-ray-XMM: (Purple); Optical (Red, Green, Blue)
Instrument: ACIS
References: Tomsick, J et al, 2012 ApJ 750:39; arXiv:1204.2836
Distance Estimate: About 30,000 light years

More aboutIGR J11014-6103: Has the Speediest Pulsar Been Found?

CID 42: Giant Black Hole Kicked Out of Home Galaxy

Posted by carsimulator on Monday, June 4, 2012

CID-42
Credit: X-ray: NASA/CXC/SAO/F.Civano et al;
Optical: NASA/STScI;
Optical (wide field): CFHT, NASA/STScI


JPEG (297.2 kb) - Tiff (37.1 MB) - More Images

Download Desktop - Press Room: CID 42

View on the Sky (WWT)


The galaxy at the center of this image contains an X-ray source, CID-42, with exceptional properties. After combining data from several telescopes - including NASA's Chandra X-ray Observatory - researchers think that CID-42 contains a massive black hole being ejected from its host galaxy at several million miles per hour.

The main panel is a wide-field image of CID-42 and its surroundings taken by the Canada-French-Hawaii Telescope and the Hubble Space Telescope in optical light. The galaxy is located nearly 4 billion light years from Earth. The outlined box on the main panel represents the more localized view of CID-42 that is shown in the three separate boxes on the right-hand side of the graphic. At the top is an image from the Chandra X-ray Observatory. The X-ray emission is concentrated in a single source, corresponding to one of the two sources seen in deep observations by Hubble, which is shown in the middle inset box. The bottom inset shows how the X-rays align with the optical data in the two insets above.

The precise location of this source was recently obtained using Chandra's High Resolution Camera, giving an important clue in telling astronomers what is happening within this galaxy. Previous Chandra observations had detected a bright X-ray source likely caused by super-heated material around one or more supermassive black holes. However, they could not distinguish if the X-rays came from one or both of the optical sources because Chandra was not pointed directly at CID-42, giving an X-ray source that was less sharp than usual.


Simulation of Black Hole Ejection
The new data help to clarify the situation. Researchers think that CID-42 is the byproduct of two galaxies that have collided, producing the distinctive tail seen in the upper part of the optical image inset. A simulation by co-author Laura Blecha shows more details of how this spectacular event was thought to unfold.

When this galaxy collision occurred, the supermassive black holes in the center of each galaxy also collided. The two black holes then merged to form a single black hole, that recoiled from gravitational waves produced by the collision, giving the newly merged black hole a sufficiently large kick for it to eventually escape from the galaxy. In this scenario, the source with the X-rays is the black hole being ejected from the galaxy. The other optical source is thought to be the bright star cluster that was left behind at the center of the galaxy.

With the higher resolution Chandra data a new feature was discovered in CID-42, a small extension to the lower right of the source. This could be a jet from the black hole or stars forming near it.

There are two other possible, but less likely, explanations for the optical data detected in CID-42. Both would involve the presence of a second supermassive black hole in CID-42, requiring X-ray emission from a second source to be heavily obscured.

Fast Facts for CID 42:

Credit: X-ray: NASA/CXC/SAO/F.Civano et al; Optical: NASA/STScI; Optical (wide field): CFHT, NASA/STScI

Scale: Wide field image is 1 arcmin (1 million light years), Zoom image is 3.7 arcsec across (70,000 light years)
Category: Quasars & Active Galaxies, Black Holes
Coordinates: (J2000) RA 10h 00m 29.06s | Dec +02° 05' 31.33"
Constellation: Sextans
Observation Dates: 2011 Jan 26
Observation Time: 22 hours 2 min
Obs. IDs: 12810
Instrument: ACIS
References: Civano, F. et al, 2012 ApJ 752:49; arXiv:1205.0815
Distance Estimate: About 3.92 billion light years

More aboutCID 42: Giant Black Hole Kicked Out of Home Galaxy

M101: A Pinwheel in Many Colors

Posted by carsimulator on Thursday, May 24, 2012

NGC 5467 - M101
The Pinwheel Galaxy
Credit X-ray: NASA/CXC/SAO;
IR & UV: NASA/JPL-Caltech;
Optical: NASA/STScI


JPEG (188.1 kb) - Tiff (7.3 MB) - More Images

Download Desktop

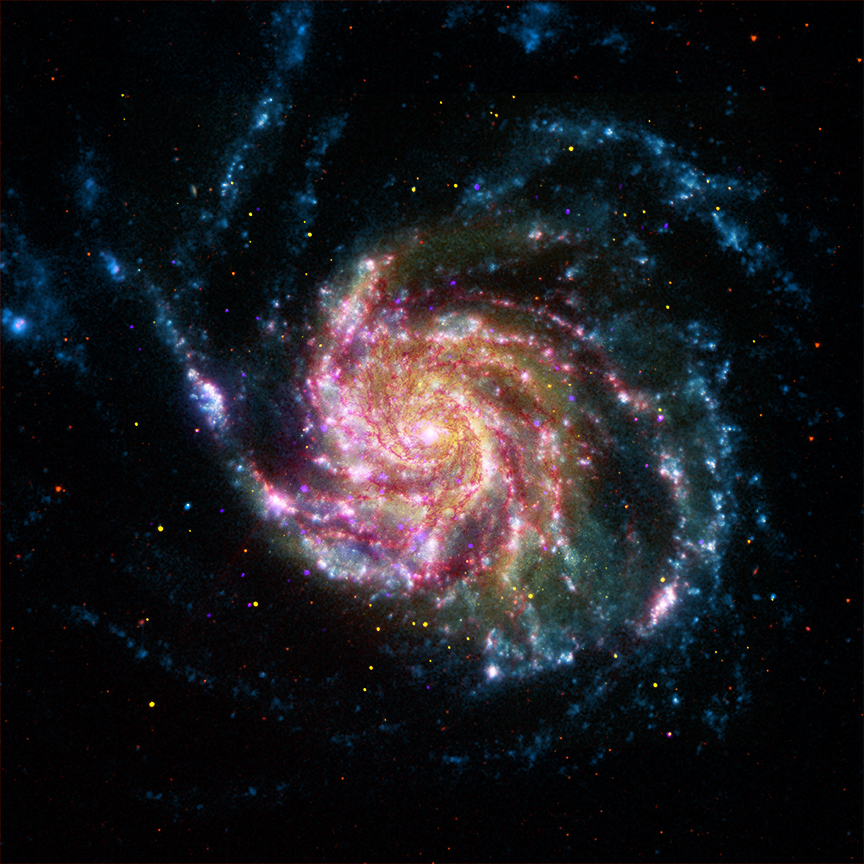
This image of the Pinwheel Galaxy, or also known as M101, combines data in the infrared, visible, ultraviolet and X-rays from four of NASA's space-based telescopes. This multi-spectral view shows that both young and old stars are evenly distributed along M101's tightly-wound spiral arms. Such composite images allow astronomers to see how features in one part of the spectrum match up with those seen in other parts. It is like seeing with a regular camera, an ultraviolet camera, night-vision goggles and X-ray vision, all at the same time.

The Pinwheel Galaxy is in the constellation of Ursa Major (also known as the Big Dipper). It is about 70% larger than our own Milky Way Galaxy, with a diameter of about 170,000 light years, and sits at a distance of 21 million light years from Earth. This means that the light we're seeing in this image left the Pinwheel Galaxy about 21 million years ago - many millions of years before humans ever walked the Earth.

The hottest and most energetic areas in this composite image are shown in purple, where the Chandra X-ray Observatory observed the X-ray emission from exploded stars, million-degree gas, and material colliding around black holes.

The Electromagnetic Spectrum.
Wavelengths and energies from gamma rays to radio

The red colors in the image show infrared light, as seen by the Spitzer Space Telescope. These areas show the heat emitted by dusty lanes in the galaxy, where stars are forming.

The yellow component is visible light, observed by the Hubble Space Telescope. Most of this light comes from stars, and they trace the same spiral structure as the dust lanes seen in the infrared.

The blue areas are ultraviolet light, given out by hot, young stars that formed about 1 million years ago, captured by the Galaxy Evolution Explorer (GALEX).

Fast Facts for M101:

Scale: Image is 16.8 arcmin across
Category: Normal Galaxies & Starburst Galaxies
Coordinates (J2000) RA 14h 03m 12.59s | Dec +54° 20’ 56.70''
Constellation: Ursa Major
Observation Dates: 03/26/2000 - 01/01/2005 with 26 pointings
Observation Time: 274 hours (11 days 10 hours)
Obs. IDs: 934, 2065, 4731-4737, 5296-5297, 5300, 5309, 5322-5323, 5337-5340, 6114-6115, 6118, 6152, 6169-6170, 6175
Color Code: X-ray (Purple); Infrared (Red); Optical (Yellow); Ultraviolet (Blue)
Instrument: ACIS
Also Known As: NGC 5457 - The Pinwheel Galaxy
Distance Estimate: About 21 million light years

More aboutM101: A Pinwheel in Many Colors

SN 2010jl: A Supernova Cocoon Breakthrough

Posted by carsimulator on Tuesday, May 15, 2012

SN 2010jl
Credit X-ray: NASA/CXC/Royal Military College of Canada/P.Chandra et al); Optical: NASA/STScI
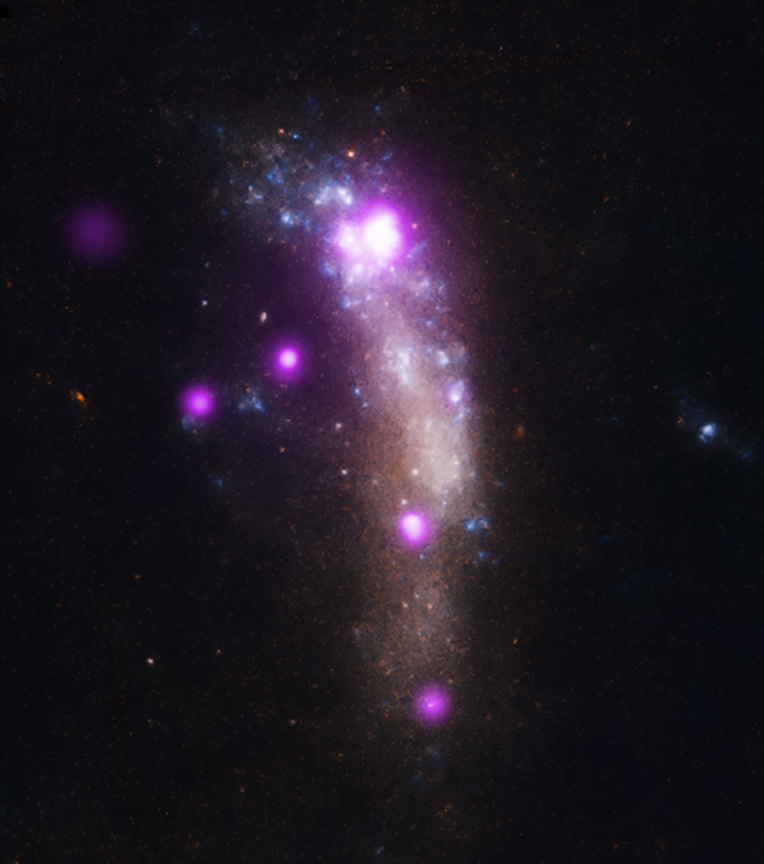
Observations with NASA's Chandra X-ray Observatory have provided the first X-ray evidence of a supernova shock wave breaking through a cocoon of gas surrounding the star that exploded. This discovery may help astronomers understand why some supernovas are much more powerful than others.

On November 3, 2010, a supernova was discovered in the galaxy UGC 5189A, located about 160 million light years away. Using data from the All Sky Automated Survey telescope in Hawaii taken earlier, astronomers determined this supernova exploded in early October 2010 (in Earth's time-frame).

This composite image of UGC 5189A shows X-ray data from Chandra in purple and optical data from Hubble Space Telescope in red, green and blue. SN 2010jl is the very bright X-ray source near the top of the galaxy.

A team of researchers used Chandra to observe this supernova in December 2010 and again in October 2011. The supernova was one of the most luminous that has ever been detected in X-rays.

In optical light, SN 2010jl was about ten times more luminous than a typical supernova resulting from the collapse of a massive star, adding to the class of very luminous supernovas that have been discovered recently with optical surveys. Different explanations have been proposed to explain these energetic supernovas including (1) the interaction of the supernova's blast wave with a dense shell of matter around the pre-supernova star, (2) radioactivity resulting from a pair-instability supernova (triggered by the conversion of gamma rays into particle and anti-particle pairs), and (3) emission powered by a neutron star with an unusually powerful magnetic field.

In the first Chandra observation of SN 2010jl, the X-rays from the explosion's blast wave were strongly absorbed by a cocoon of dense gas around the supernova. This cocoon was formed by gas blown away from the massive star before it exploded.

In the second observation taken almost a year later, there is much less absorption of X-ray emission, indicating that the blast wave from the explosion has broken out of the surrounding cocoon. The Chandra data show that the gas emitting the X-rays has a very high temperature -- greater than 100 million degrees Kelvin - strong evidence that it has been heated by the supernova blast wave.

The energy distribution, or spectrum, of SN 2010jl in optical light reveals features that the researchers think are explained by the following scenario: matter around the supernova has been heated and ionized (electrons stripped from atoms) by X-rays generated when the blast wave plows through this material. While this type of interaction has been proposed before, the new observations directly show, for the first time, that this is happening.

This discovery therefore supports the idea that some of the unusually luminous supernovas are caused by the blast wave from their explosion ramming into the material around it.

In a rare example of a cosmic coincidence, analysis of the X-rays from the supernova shows that there is a second unrelated source at almost the same location as the supernova. These two sources strongly overlap one another as seen on the sky. This second source is likely to be an ultraluminous X-ray source, possibly containing an unusually heavy stellar-mass black hole, or an intermediate mass black hole.

These results were published in a paper appearing in the May 1st, 2012 issue of The Astrophysical Journal Letters. The authors were Poonam Chandra (Royal Military College of Canada, Kingston, Canada), Roger Chevalier and Christopher Irwin (University of Virginia, Charlottsville, VA), Nikolai Chugai (Institute of Astronomy of Russian Academy of Sciences, Moscow, Russia), Claes Fransson (Stockholm University, Sweden), and Alicia Soderberg (Harvard-Smithsonian Center for Astrophysics, Cambridge, MA).

Fast Facts for SN 2010jl:

Scale: 46 arcsec across (36,000 light years)
Category: Supernovas & Supernova Remnants
Coordinates: (J2000) RA 09h 42m 53.33s | Dec +09° 29' 41.80"
Constellation: Leo
Observation Date: 3 pointings between 7 Dec 2010 and 17 Oct 2011
Observation Time: 22 hours 13 min.
Obs. ID: 11122, 13199, 13781
Color Code: X-ray (Purple); Optical (Red, Green, Blue)
Instrument: ACIS
References: Chandra, P. et al, 2012 ApJ 750:L2; arXiv:1203.1614
Distance Estimate: 163 million light years

More aboutSN 2010jl: A Supernova Cocoon Breakthrough

M83: A Remarkable Outburst from an Old Black Hole

Posted by carsimulator on Monday, April 30, 2012

M83
Credit Left image - Optical: ESO/VLT; Close-up - X-ray: NASA/CXC/Curtin University/R.Soria et al., Optical: NASA/STScI/Middlebury College/F.Winkler et al.


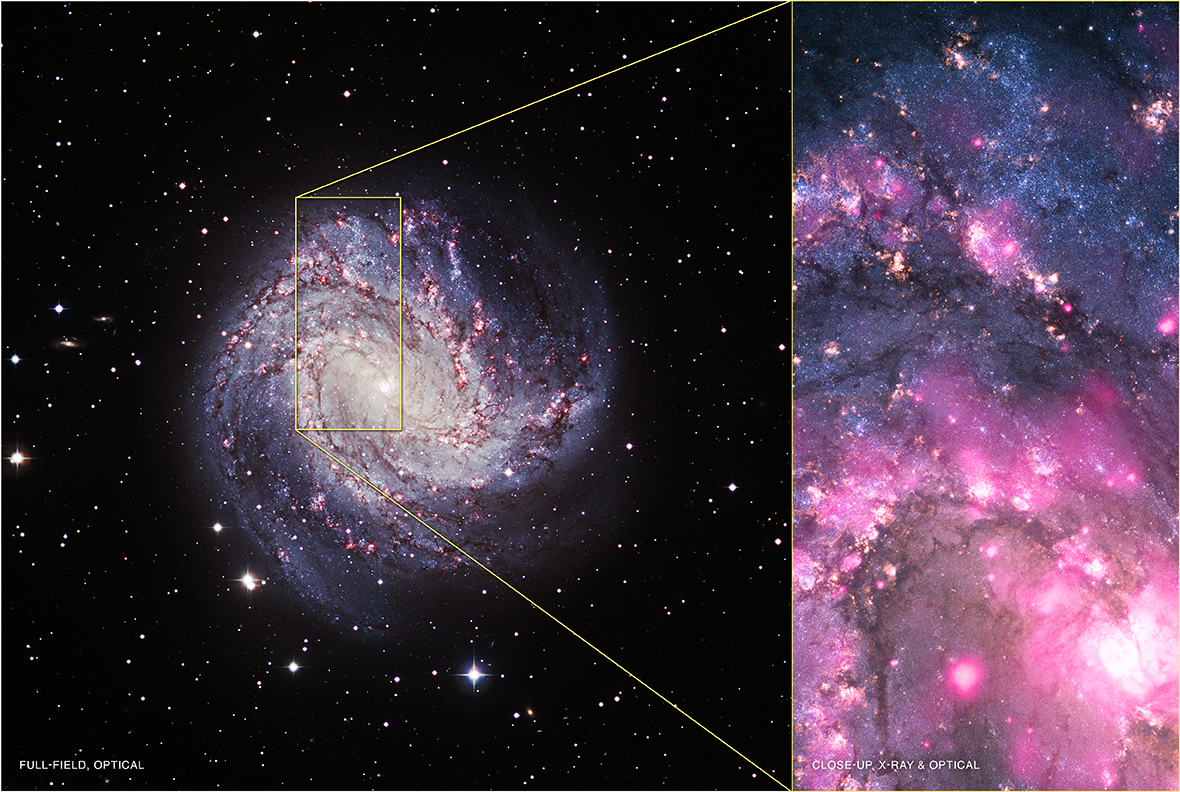
NASA's Chandra X-ray Observatory has discovered an extraordinary outburst by a black hole in the spiral galaxy M83, located about 15 million light years from Earth. Using Chandra, astronomers found a new ultraluminous X-ray source (ULX), objects that give off more X-rays than most "normal" binary systems in which a companion star is in orbit around a neutron star or black hole.

On the left is an optical image of M83 from the Very Large Telescope in Chile, operated by the European Southern Observatory. On the right is a composite image showing X-ray data from Chandra in pink and optical data from the Hubble Space Telescope in blue and yellow. The ULX is located near the bottom of the composite image.

In Chandra observations that spanned several years, the ULX in M83 increased in X-ray brightness by at least 3,000 times. This sudden brightening is one of the largest changes in X-rays ever seen for this type of object, which do not usually show dormant periods.

Optical images reveal a bright blue source at the position of the ULX during the X-ray outburst. Before the outburst the blue source is not seen. These results imply that the companion to the black hole in M83 is a red giant star, more than about 500 million years old, with a mass less than about four times the Sun's. According to theoretical models for the evolution of stars, the black hole should be almost as old as its companion.


Astronomers think that the bright, blue optical emission seen during the X-ray outburst must have been caused by a disk surrounding the black hole that brightened dramatically as it gained more material from the companion star.

Another highly variable ULX with an old, red star as a companion to a black hole was found recently in M31. The new ULXs in M83 and M31 provide direct evidence for a population of black holes that are much older and more volatile than those usually considered to be found in these objects.

The researchers estimate a mass range for the M83 ULX from 40 to 100 times that of the Sun. Lower masses of about 15 times the mass of the Sun are possible, but only if the ULX is producing more X-rays than predicted by standard models of how material falls onto black holes.

Evidence was also found that the black hole in this system may have formed from a star surprisingly rich in "metals", as astronomers call elements heavier than helium. The ULX is located in a region that is known, from previous observations, to be rich with metals.

Large numbers of metals increase the mass-loss rate for massive stars, decreasing their mass before they collapse. This, in turn, decreases the mass of the resulting black hole. Theoretical models suggest that with a high metal content only black holes with masses less than about 15 times that of the Sun should form. Therefore, these results may challenge these models.

This surprisingly rich "recipe" for a black hole is not the only possible explanation. It may also be that the black hole is so old that it formed at a time when heavy elements were much less abundant in M83, before seeding by later generations of supernovas. Another explanation is that the mass of the black hole is only about 15 times that of the Sun.

Fast Facts for M83:

Scale: Left image is 17.6 arcmin on a side (~77,000 light years); Close-up: 0.6 x 1.2 arcmin (~2600 x ~5200 light years)
Coordinates: (J2000) RA 13h 37m 00.80s | Dec -29° 51’ 58.60"
Constellation: Hydra
Observation Dates: 12 pointings between April 29, 2000 and Dec 28, 2011
Observation Time: 219 hours 49 min (9 days 3 hours 49 min)
Obs. IDs: 793, 2064, 12992-12996, 13202, 13241, 13248, 14332, 14342
Instrument: ACIS
Also Known As: NGC 5236
References: Soria, R. et al, 2012, ApJ (in press) arXiv:1203.2335
Kaur, A. et al, 2012, A&A 538, A49 arXiv:1109.1547
Middleton, M.J., et al, 2012, MNRAS, 420, 2969 arXiv:1111.1188
Distance Estimate: About 15 million light years

More aboutM83: A Remarkable Outburst from an Old Black Hole

DLSCL J0916.2+2951: Discovery of the Musket Ball Cluster

Posted by carsimulator on Thursday, April 12, 2012

Musket Ball Cluster
Credit X-ray: NASA/CXC/UCDavis/W.Dawson et al;


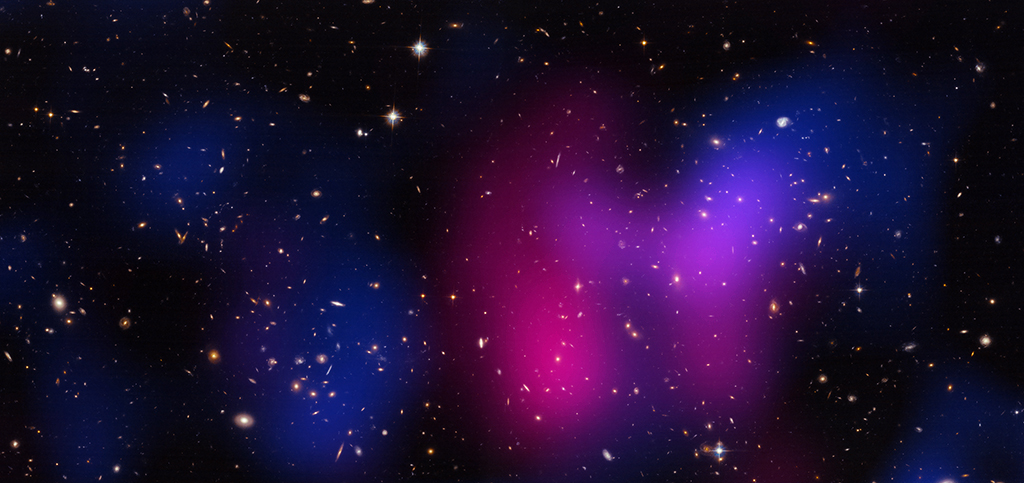
Using a combination of powerful observatories in space and on the ground, astronomers have observed a violent collision between two galaxy clusters in which so-called normal matter has been wrenched apart from dark matter through a violent collision between two galaxy clusters.


The newly discovered galaxy cluster is called DLSCL J0916.2+2951. It is similar to the Bullet Cluster, the first system in which the separation of dark and normal matter was observed, but with some important differences. The newly discovered system has been nicknamed the "Musket Ball Cluster" because the cluster collision is older and slower than the Bullet Cluster.

Finding another system that is further along in its evolution than the Bullet Cluster gives scientists valuable insight into a different phase of how galaxy clusters - the largest known objects held together by gravity - grow and change after major collisions. Researchers used observations from NASA's Chandra X-ray Observatory and Hubble Space Telescope as well as the Keck, Subaru and Kitt Peak Mayall telescopes to show that hot, X-ray bright gas in the Musket Ball Cluster has been clearly separated from dark matter and galaxies.

In this composite image, the hot gas observed with Chandra is colored red, and the galaxies in the optical image from Hubble appear as mostly white and yellow. The location of the majority of the matter in the cluster (dominated by dark matter) is colored blue. When the red and the blue regions overlap, the result is purple as seen in the image. The matter distribution is determined by using data from Subaru, Hubble and the Mayall telescope that reveal the effects of gravitational lensing, an effect predicted by Einstein where large masses can distort the light from distant objects.

In addition to the Bullet Cluster, five other similar examples of merging clusters with separation between normal and dark matter and varying levels of complexity, have previously been found. In these six systems, the collision is estimated to have occurred between 170 million and 250 million years

Credit X-ray: NASA/CXC/CfA/M.Markevitch et al.;
Optical: NASA/STScI; Magellan/U.Arizona/D.Clowe et al.;
Lensing Map: NASA/STScI; ESO WFI; Magellan/U.Arizona/D.Clowe et al.

In the Musket Ball Cluster, the system is observed about 700 million years after the collision. Taking into account the uncertainties in the age estimate, the merger that has formed the Musket Ball Cluster is two to five times further along than in previously observed systems. Also, the relative speed of the two clusters that collided to form the Musket Ball cluster was lower than most of the other Bullet Cluster-like objects.

The special environment of galaxy clusters, including the effects of frequent collisions with other clusters or groups of galaxies and the presence of large amounts of hot, intergalactic gas, is likely to play an important role in the evolution of their member galaxies. However, it is still unclear whether cluster mergers trigger star formation, suppress it, or have little immediate effect. The Musket Ball Cluster holds promise for deciding between these alternatives.

The Musket Ball Cluster also allows an independent study of whether dark matter can interact with itself. This information is important for narrowing down the type of particle that may be responsible for dark matter. No evidence is reported for self-interaction in the Musket Ball Cluster, consistent with the results for the Bullet Cluster and the other similar clusters.

The Musket Ball Cluster is located about 5.2 billion light years away from Earth. A paper describing these results was led by Will Dawson from University of California, Davis and was published in the March 10, 2012 issue of The Astrophysical Journal Letters. The other co-authors were David Wittman, M. James Jee and Perry Gee from UC Davis, Jack Hughes from Rutgers University in NJ, J. Anthony Tyson, Samuel Schmidt, Paul Thorman and Marusa Bradac from UC Davis, Satoshi Miyazaki from the Graduate University for Advanced Studies (GUAS) in Tokyo, Japan, Brian Lemaux from UC Davis, Yousuke Utsumi from GUAS and Vera Margoniner from California State University, Sacramento.

NASA's Marshall Space Flight Center in Huntsville, Ala., manages the Chandra program for NASA's Science Mission Directorate in Washington. The Smithsonian Astrophysical Observatory controls Chandra's science and flight operations from Cambridge, Mass.

Fast Facts for DLSCL J0916.2+2951:

Scale: 6.4 arcmin across (about 8 million light years)
Category: Groups & Clusters of Galaxies
Coordinates (J2000): RA 09h 16m 14.64s | Dec +29° 54' 24.00"
Constellation: Cancer
Observation Date: Jan 2, 2011
Observation Time: 11 hours 6 min.
Obs. ID: 12913
Color Code: Optical (Red, Green, Blue); X-ray (Red-Purple); Mass Map (Blue)
Instrument: ACIS
References: Dawson, W. et al, 2012, ApJ 747, 42; arXiv:1110.4391
Distance Estimate: 5.23 billion light years (z=0.53)

More aboutDLSCL J0916.2+2951: Discovery of the Musket Ball Cluster

Cassiopeia A: A Star Explodes and Turns Inside Out

Posted by carsimulator on Thursday, March 29, 2012

Credit Illustration: NASA/CXC/M.Weiss;
X-ray: NASA/CXC/GSFC/U.Hwang & J.Laming

JPEG (425 kb) - Tiff (35.7 MB) - More Images


A new X-ray study of the remains of an exploded star indicates that the supernova that disrupted the massive star may have turned it inside out in the process. Using very long observations of Cassiopeia A (or Cas A), a team of scientists has mapped the distribution of elements in the supernova remnant in unprecedented detail. This information shows where the different layers of the pre-supernova star are located three hundred years after the explosion, and provides insight into the nature of the supernova.

An artist's illustration on the left shows a simplified picture of the inner layers of the star that formed Cas A just before it exploded, with the predominant concentrations of different elements represented by different colors: iron in the core (blue), overlaid by sulfur and silicon (green), then magnesium, neon and oxygen (red). The image from NASA's Chandra X-ray Observatory on the right uses the same color scheme to show the distribution of iron, sulfur and magnesium in the supernova remnant. The data show that the distributions of sulfur and silicon are similar, as are the distributions of magnesium and neon. Oxygen, which according to theoretical models is the most abundant element in the remnant, is difficult to detect because the X-ray emission characteristic of oxygen ions is strongly absorbed by gas in along the line of sight to Cas A, and because almost all the oxygen ions have had all their electrons stripped away.

A comparison of the illustration and the Chandra element map shows clearly that most of the iron, which according to theoretical models of the pre-supernova was originally on the inside of the star, is now located near the outer edges of the remnant. Surprisingly, there is no evidence from X-ray (Chandra) or infrared (Spitzer Space Telescope) observations for iron near the center of the remnant, where it was formed. Also, much of the silicon and sulfur, as well as the magnesium, is now found toward the outer edges of the still-expanding debris. The distribution of the elements indicates that a strong instability in the explosion process somehow turned the star inside out.

This latest work, which builds on earlier Chandra observations, represents the most detailed study ever made of X-ray emitting debris in Cas A, or any other supernova remnant resulting from the explosion of a massive star. It is based on a million seconds of Chandra observing time. Tallying up what they see in the Chandra data, astronomers estimate that the total amount of X-ray emitting debris has a mass just over three times that of the Sun. This debris was found to contain about 0.13 times the mass of the Sun in iron, 0.03 in sulfur and only 0.01 in magnesium.

The researchers found clumps of almost pure iron, indicating that this material must have been produced by nuclear reactions near the center of the pre-supernova star, where the neutron star was formed. That such pure iron should exist was anticipated because another signature of this type of nuclear reaction is the formation of the radioactive nucleus titanium-44, or Ti-44. Emission from Ti-44, which is unstable with a half-life of 63 years, has been detected in Cas A with several high-energy observatories including the Compton Gamma Ray Observatory, BeppoSAX, and the International Gamma-Ray Astrophysics Laboratory (INTEGRAL).

These results appeared in the February 20th issue of The Astrophysical Journal in a paper by Una Hwang of Goddard Space Flight Center and Johns Hopkins University, and (John) Martin Laming of the Naval Research Laboratory.

Fast Facts for Cassiopeia A:

Credit Illustration: NASA/CXC/M.Weiss; X-ray: NASA/CXC/GSFC/U.Hwang & J.Laming
Scale Image is 8.4 arcmin across (about 27 light years)
Category: Supernovas & Supernova Remnants
Coordinates: (J2000) RA 23h 23m 26.7s | Dec +58° 49' 03.00"
Constellation: Cassiopeia
Observation Dates: 9 pointings between Feb 8 and May 5, 2004
Observation Time: 272 hours 13 min (11 days 8 hours 13 min)
Obs. IDs: 4634-4639, 5196, 5319-5320
Instrument: ACIS
Also Known As: Cas A
References: Hwang, U. et al, 2012, ApJ, 746, 130; arXiv:1111.7316
Distance Estimate: About 11,000 light years

More aboutCassiopeia A: A Star Explodes and Turns Inside Out

Abell 383: Getting a Full Picture of an Elusive Subject

Posted by carsimulator on Wednesday, March 14, 2012

Abell 383
Credit: X-ray: NASA/CXC/Caltech/A.Newman et al/Tel Aviv/A.Morandi & M.Limousin; Optical: NASA/STScI, ESO/VLT, SDSS

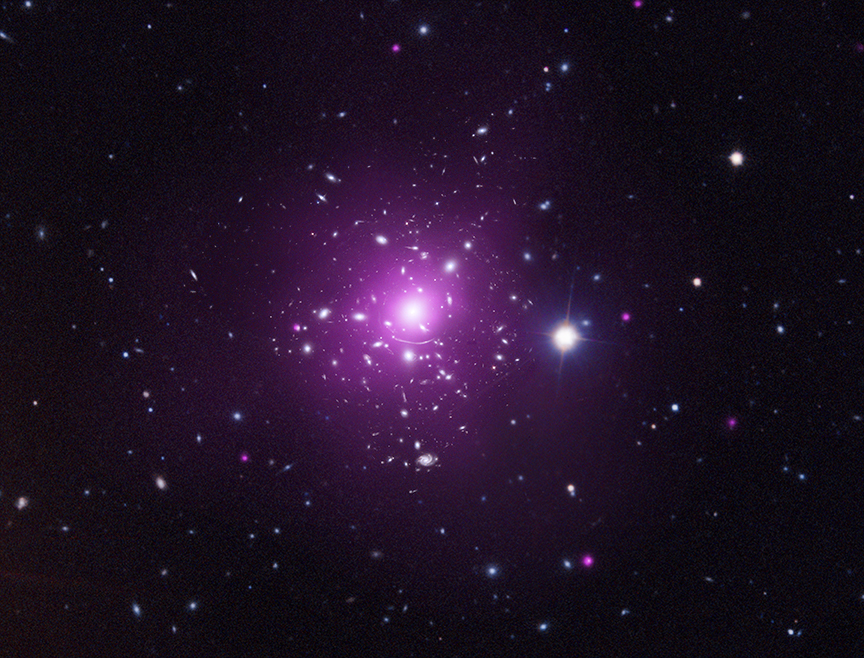
Two teams of astronomers have used data from NASA's Chandra X-ray Observatory and other telescopes to map the distribution of dark matter in a galaxy cluster known as Abell 383, which is located about 2.3 billion light years from Earth. Not only were the researchers able to find where the dark matter lies in the two dimensions across the sky, they were also able to determine how the dark matter is distributed along the line of sight.

Dark matter is invisible material that does not emit or absorb any type of light, but is detectable through its gravitational effects. Several lines of evidence indicate that there is about six times as much dark matter as "normal", or baryonic, matter in the Universe. Understanding the nature of this mysterious matter is one of the outstanding problems in astrophysics.

Galaxy clusters are the largest gravitationally-bound structures in the universe, and play an important role in research on dark matter and cosmology, the study of the structure and evolution of the universe. The use of clusters as dark matter and cosmological probes hinges on scientists' ability to use objects such as Abell 383 to accurately determine the three-dimensional structures and masses of clusters.

The recent work on Abell 383 provides one of the most detailed 3-D pictures yet taken of dark matter in a galaxy cluster. Both teams have found that the dark matter is stretched out like a gigantic football, rather than being spherical like a basketball, and that the point of the football is aligned close to the line of sight.

The X-ray data (purple) from Chandra in the composite image show the hot gas, which is by far the dominant type of normal matter in the cluster. Galaxies are shown with the optical data from the Hubble Space Telescope (HST), the Very Large Telescope, and the Sloan Digital Sky Survey, colored in blue and white.

Both teams combined the X-ray observations of the "normal matter" in the cluster with gravitational lensing information determined from optical data. Gravitational lensing - an effect predicted by Albert Einstein - causes the material in the galaxy cluster, both normal and dark matter, to bend and distort the optical light from background galaxies. The distortion is severe in some parts of the image, producing an arc-like appearance for some of the galaxies. In other parts of the image the distortion is subtle and statistical analysis is used to study the distortion effects and probe the dark matter.

A considerable amount of effort has gone into studying the center of galaxy clusters, where the dark matter has the highest concentration and important clues about its behavior might be revealed. Both of the Abell 383 studies reported here continue that effort.

The team of Andrea Morandi from Tel Aviv University in Israel and Marceau Limousin from Université de Provence in France and University of Copenhagen in Denmark concluded that the increased concentration of the dark matter toward the center of the cluster is in agreement with most theoretical simulations. Their lensing data came from HST images.

The team led by Andrew Newman of the California Institute of Technology and Tommaso Treu of University of California, Santa Barbara (UCSB) used lensing data from HST and the Japanese telescope Subaru, but added Keck observations to measure the velocities of stars in the galaxy in the center of the cluster, allowing for a direct estimate of the amount of matter there. They found evidence that the amount of dark matter is not peaked as dramatically toward the center as the standard cold dark matter model predicts. Their paper describes this as being the "most robust case yet" made for such a discrepancy with the theory.

The contrasting conclusions reached by the two teams most likely stem from differences in the data sets and the detailed mathematical modeling used. One important difference is that because the Newman et al. team used velocity information in the central galaxy, they were able to estimate the density of dark matter at distances that approached as close as only 6,500 light years from the center of the cluster. Morandi and Limousin did not use velocity data and their density estimates were unable to approach as close to the cluster's center, reaching to within 80,000 light years.

Another important difference is that Morandi and Limousin used a more detailed model for the 3-D map of dark matter in the cluster. For example, they were able to estimate the orientation of the dark matter "football" in space and show that it is mostly edge-on, although slightly tilted with respect to the line of sight.

As is often the case with cutting-edge and complex results, further work will be needed to resolve the discrepancy between the two teams. In view of the importance of resolving the dark matter mystery, there will undoubtedly be much more research into Abell 383 and other objects like it in the months and years to come.

If the relative lack of dark matter in the center of Abell 383 is confirmed, it may show that improvements need to be made in our understanding of how normal matter behaves in the center of galaxy clusters, or it may show that dark matter particles can interact with each other, contrary to the prevailing model.

The Newman et al. paper was published in the February 20, 2011 issue of the Astrophysical Journal Letter and the Morandi and Limousin paper has been accepted for publication in the Monthly Notices of the Royal Astronomical Society. Other members of the Newman et al. team were Richard Ellis from Caltech, and David Sand from Las Cumbres Global Telescope Network and UCSB.

Fast Facts for Abell 383:

Scale: 7.26 arcmin across (4.84 million light years)
Category: Groups & Clusters of Galaxies
Coordinates: (J2000) RA 02h 48m 06.96s | Dec -03º 29' 31.81"
Constellation: Eridanus
Observation Date: 3 pointings between Sep and Nov 2000
Observation Time: 13 hours 43 min.
Obs. ID: 524, 2320, 2321
Color Code: X-ray (Purple), Optical (White & Blue)
Instrument: ACIS
References: Newman,A. et al. 2011 ApJ 728:L39; arXiv:1101.3553; Morandi, A., Limousin, M. 2011 MNRAS (in press);arXiv:1108.0769
Distance Estimate: 2.3 billion light years (z=0.189)

More aboutAbell 383: Getting a Full Picture of an Elusive Subject

Sagittarius A*: NASA's Chandra Finds Milky Way's Black Hole May be Grazing on Asteroids

Posted by carsimulator on Wednesday, February 8, 2012

Mysterious X-ray flares caught by Chandra may be asteroids falling into the Milky Way's giant black hole. Credit: X-ray: NASA/CXC/MIT/F. Baganoff et al.; Illustrations: NASA/CXC/M.Weiss


(Runtime: 00:29)


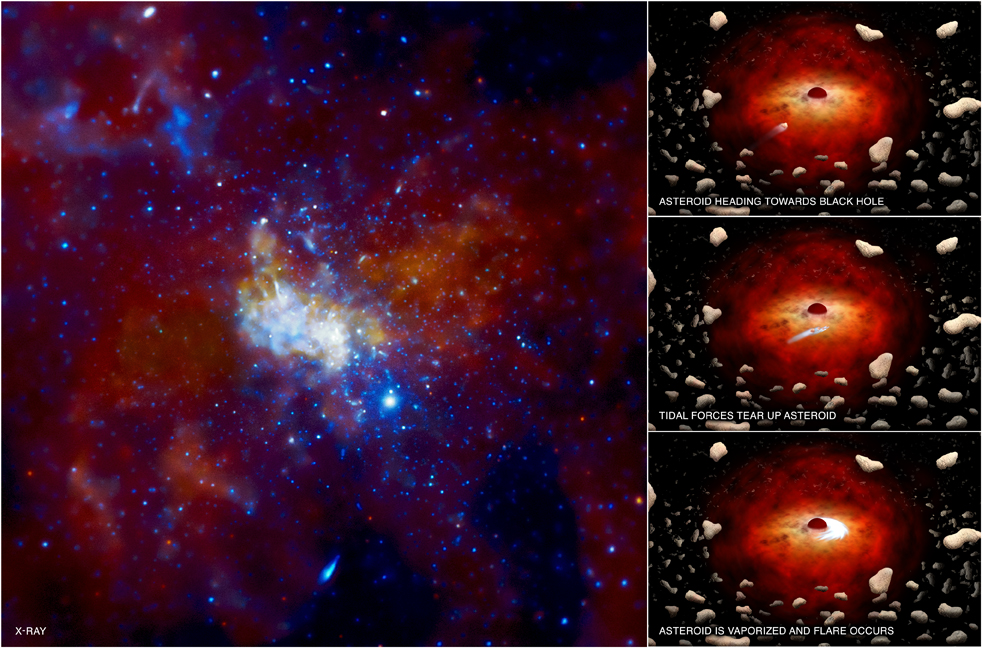
This image from NASA's Chandra X-ray Observatory shows the center of our Galaxy, with a supermassive black hole known as Sagittarius A* (Sgr A* for short) in the center. Using intermittent observations over several years, Chandra has detected X-ray flares about once a day from Sgr A*. The flares have also been seen in infrared data from ESO's Very Large Telescope in Chile.

A new study provides a possible explanation for the mysterious flares. The suggestion is that there is a cloud around Sgr A* containing hundreds of trillions of asteroids and comets, which have been stripped from their parent stars. The panel on the left is an image containing nearly a million seconds of Chandra observing of the region around the black hole, with red representing low-energy X-rays, green as medium-energy X-rays, and blue being the highest.

An asteroid that undergoes a close encounter with another object, such as a star or planet, can be thrown into an orbit headed towards Sgr A*, as seen in a series of artist's illustrations beginning with the top-right panel. If the asteroid passes within about 100 million miles of the black hole, roughly the distance between the Earth and the Sun, it would be torn into pieces by the tidal forces from the black hole (middle-right panel).

These fragments would then be vaporized by friction as they pass through the hot, thin gas flowing onto Sgr A*, similar to a meteor heating up and glowing as it falls through Earth's atmosphere. A flare is produced (bottom-right panel) and eventually the remains of the asteroid are swallowed by the black hole.

Chandra Image of Environment Around Milky Way's Black Hole

Another solar system analogy for this type of event has recently been reported. About once every three days a comet is destroyed when it flies into the hot atmosphere of the Sun. So, despite the significant differences in the two environments, the destruction rate of comets and asteroids by the Sun and Sgr A* may be similar.

Very long observations of Sgr A* will be made with Chandra later in 2012 that will give valuable new information about the frequency and brightness of flares and should help to test the model proposed here to explain them. This work has the potential to understand the ability of asteroids and planets to form in the harsh environment of Sgr A*.

Fast Facts for Sagittarius A*:

Scale: Image is 15 arcmin across (20 light years)
Category:Black Holes, Milky Way Galaxy
Coordinates: (J2000) RA 17h 45m 40s | Dec -29° 00' 28.00"
Constellation: Sagittarius
Observation Dates: 43 pointings from September 21, 1999 to May 18, 2009
Observation Time; 278 hours (11 days 14 hours)
Obs. IDs: 242, 1561, 2943, 2951-2954, 3392, 3393, 3549, 3663, 3665, 4683, 4684, 5360, 5950-5954, 6113, 6363, 6639, 6640-6646, 7554-7759, 9169-9174, 10556
Color Code: X-ray: Energy: Red (2-3.3 keV), Green (3.3-4.7 keV), Blue (4.7-8 keV)
Instrument: ACIS
Also Known As: Galactic Center
References: K. Zubovas et al., 2012, MNRAS, in press; arXiv:1110.6872
Distance Estimate: About 26,000 light years

More aboutSagittarius A*: NASA's Chandra Finds Milky Way's Black Hole May be Grazing on Asteroids

G350.1-0.3: Remnant of an Explosion With a Powerful Kick?

Posted by carsimulator on Wednesday, February 1, 2012

G350.1+0.3


Vital clues about the devastating ends to the lives of massive stars can be found by studying the aftermath of their explosions. In its more than twelve years of science operations, NASA's Chandra X-ray Observatory has studied many of these supernova remnants sprinkled across the Galaxy.

The latest example of this important investigation is Chandra's new image of the supernova remnant known as G350.1+0.3. This stellar debris field is located some 14,700 light years from the Earth toward the center of the Milky Way .

Evidence from Chandra and from ESA's XMM-Newton telescope suggest that a compact object within G350.1+0.3 may be the dense core of the star that exploded. The position of this likely neutron star, seen by mousing over the image above, is well away from the center of the X-ray emission (mouse-over for this position). If the supernova explosion occurred near the center of the X-ray emission then the neutron star must have received a powerful kick in the supernova explosion.

Data from Chandra and other telescopes suggest this supernova remnant, as it appears in the image, is between 600 and 1,200 years old. If the estimated location of the explosion is correct, this means that the neutron star has been moving at a speed of at least 3 million miles per hour since the explosion This is comparable to the exceptionally high speed derived for the neutron star in Puppis A and provides new evidence that extremely powerful "kicks" can be imparted to neutron stars from supernova explosions.

Another intriguing aspect of G350.1+0.3 is its unusual shape. While many supernova remnants are nearly circular, G350.1+0.3 is strikingly asymmetrical as seen in the Chandra data in this image (gold). Infrared data from NASA's Spitzer Space Telescope (light blue) also trace the morphology found by Chandra. Astronomers think that this bizarre shape is due to the stellar debris field expanding into a nearby cloud of cold molecular gas.

The age of 600-1,200 years puts the explosion that created G350.1+0.3 in the same time frame as other famous supernovas that formed the Crab and SN 1006 supernova remnants. However, it is unlikely that anyone on Earth would have seen the explosion because of the obscuring gas and dust that lies along our line of sight to the remnant.

These results appeared in the April 10, 2011 issue of The Astrophysical Journal. The scientists on this paper were Igor Lovchinsky and Patrick Slane (Harvard-Smithsonian Center for Astrophysics), Bryan Gaensler (University of Sydney, Australia), Jack Hughes (Rutgers University), Jasmina Lazendic (Monash University Clayton, Australia), Joseph Gelfand (New York University, Abu Dhabi), and Crystal Brogan (National Radio Astronomy Observatory).

Fast Facts for G350.1-0.3:

Scale: 5.2 arcmin across (about 22 light years)
Category: Supernovas & Supernova Remnants, Neutron Stars/X-ray Binaries
Coordinates: (J2000) RA 17h 21m 03.00s | Dec -37° 26' 50.00"
Constellation: Scorpius
Observation Date: 5/24/2009
Observation Time: 23 hours 3 min.
Obs. ID: 10102
Color Code: X-ray (Gold); Infrared 24 micron (Cyan); Infrared 8 micron (Purple); Infrared: 3.6 micron (Green)
Instrument: ACIS
References: Lovchinsky, I. et al, 2011, ApJ, 731, 70
Distance Estimate: 14,700 light years

More aboutG350.1-0.3: Remnant of an Explosion With a Powerful Kick?

El Gordo (ACT-CL J0102-4915): NASA's Chandra Finds Largest Galaxy Cluster in Early Universe

Posted by carsimulator on Tuesday, January 10, 2012

Credit X-ray: NASA/CXC/Rutgers/J.Hughes et al, Optical: ESO/VLT/Pontificia Universidad. Catolica de Chile/L.Infante & SOAR (MSU/NOAO/UNC/CNPq-Brazil)/Rutgers/F.Menanteau, IR: NASA/JPL/Rutgers/F.Menanteau


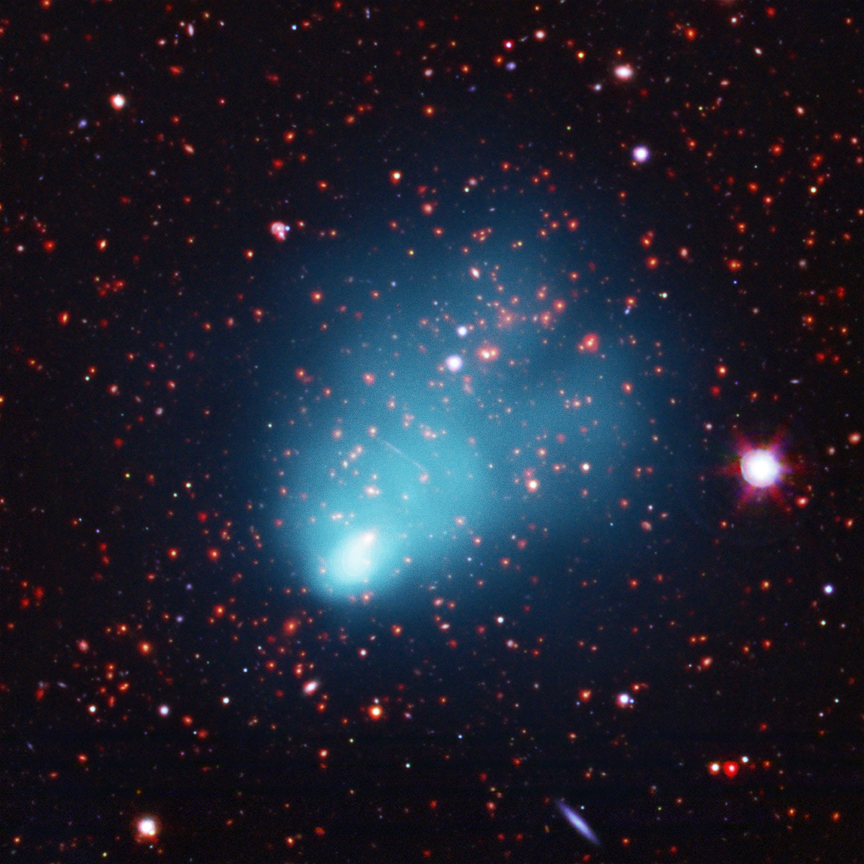
A composite image shows El Gordo in X-ray light from NASA's Chandra X-ray Observatory in blue, along with optical data from the European Southern Observatory's Very Large Telescope (VLT) in red, green, and blue, and infrared emission from the NASA's Spitzer Space Telescope in red and orange.

X-ray data from Chandra reveal a distinct cometary appearance of El Gordo, including two "tails" extending to the upper right of the image. Along with the VLT's optical data, this shows that El Gordo is, in fact, the site of two galaxy clusters running into one another at several million miles per hour. This and other characteristics make El Gordo akin to the well-known object called the Bullet Cluster, which is located almost 4 billion light years closer to Earth.

As with the Bullet Cluster, there is evidence that normal matter, mainly composed of hot, X-ray bright gas, has been wrenched apart from the dark matter in El Gordo. The hot gas in each cluster was slowed down by the collision, but the dark matter was not.

El Gordo is located over 7 billion light years from Earth, meaning that it is being observed at a young age. According to the scientists involved in this study, this cluster of galaxies is the most massive, the hottest, and gives off the most X-rays of any known cluster at this distance or beyond.
The central galaxy in the middle of El Gordo is unusually bright and has surprisingly blue colors in optical wavelengths. The authors speculate that this extreme galaxy resulted from a collision and merger between the two galaxies at the center of each cluster.

Using Spitzer data and optical imaging it is estimated that about 1% of the total mass of the cluster is in stars, while the rest is found in the hot gas that fills the space between the stars and is detected by Chandra. This ratio of stars to gas is similar with results from other massive clusters.

Fast Facts for El Gordo:

Scale Image is 5.3 arcmin across
Category: Groups & Clusters of Galaxies
Coordinates: (J2000) RA 01h 02m 52.50s | Dec -49° 14' 58.00"
Constellation: Phoenix
Observation Date: 01/26/2011
Observation Time: 16 hours 40 min.
Obs. ID: 12258
Color Code: X-ray (Blue); Optical (Red, Green, Blue); Infrared (Red)
Instrument: ACIS
Also Known As: ACT-CL J0102-4915
References: Menanteau, F. et al, 2011 ApJ (submitted); arXiv:1109.0953
Distance Estimate: 7.166 billion light years

More aboutEl Gordo (ACT-CL J0102-4915): NASA's Chandra Finds Largest Galaxy Cluster in Early Universe

Abell 2052: A Galaxy Cluster Gets Sloshed

Posted by carsimulator on Wednesday, December 14, 2011

Abell 2052
Credit: X-ray: NASA/CXC/BU/E.Blanton; Optical: ESO/VLT


JPEG (418.4 kb) - Tiff (8.6 MB) - PS ( bytes) - More Images

High-Quality Prints - Image with Scalebar

Zoom-In (flash)

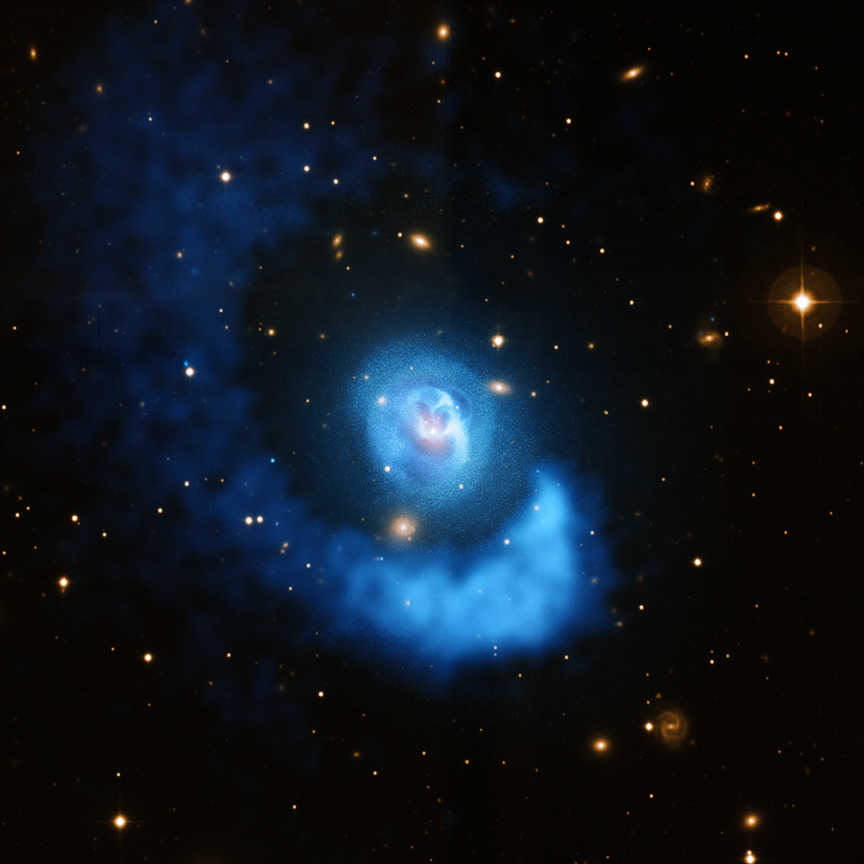
Like wine in a glass, vast clouds of hot gas are sloshing back and forth in Abell 2052, a galaxy cluster located about 480 million light years from Earth. X-ray data (blue) from NASA's Chandra X-ray Observatory shows the hot gas in this dynamic system, and optical data (gold) from the Very Large Telescope shows the galaxies. The hot, X-ray bright gas has an average temperature of about 30 million degrees.

A huge spiral structure in the hot gas - spanning almost a million light years - is seen around the outside of the image, surrounding a giant elliptical galaxy at the center. This spiral was created when a small cluster of galaxies smashed into a larger one that surrounds the central elliptical galaxy.
As the smaller cluster approached, the dense hot gas of the central cluster was attracted to it by gravity. After the smaller cluster passed the cluster core, the direction of motion of the cluster gas reversed and it traveled back towards the cluster center. The cluster gas moved through the center again and "sloshed" back and forth, similar to wine sloshing in a glass that was jerked sideways. The sides of the glass push the wine back to the center, whereas in the cluster the gravitational force of the matter in the clusters pulls it back. The sloshing gas ended up in a spiral pattern because the collision between the two clusters was off-center.

Wine sloshing in a glass
Wine sloshing backwards and forwards in a glass provides a small-scale analogy to hot gas sloshing backwards and forwards, over vast scales, in a galaxy cluster. Credit: Markevitch & Vikhlinin (2007)

This type of sloshing in Abell 2052 has important physical implications. First, it helps push some of the more dense, cooler gas located in the center of the cluster -- where temperatures are only about 10 million degrees -- farther away from the core. This helps prevent further cooling of this gas in the core and could limit the amount of new stars being formed in the central galaxy. Sloshing motions like those seen in Abell 2052 also redistribute heavy elements, like iron and oxygen, which are forged in supernova explosions. These elements are used in the future generations of stars and planets and are necessary for life as we know it.

Chandra's observation of Abell 2052 was particularly long, lasting more than a week. Such a deep observation was necessary to detect all of the details in this image. Even then, processing to emphasize more subtle features was necessary to reveal the outer spiral structure.

In addition to the large-scale spiral feature, the deep Chandra observation reveals exquisite detail in the cluster center related to outbursts from the central supermassive black hole. The Chandra data show clear bubbles evacuated by material blasted away from the black hole, which are surrounded by dense, bright, cool rims. As with the sloshing, this activity helps prevent cooling of the gas in the cluster's core, setting limits on the growth of the giant elliptical galaxy and its supermassive black hole.

These results were published in the August 20, 2011 issue of The Astrophysical Journal. The authors were Elizabeth Blanton of Boston University, Boston, MA; Scott Randall of the Harvard-Smithsonian Center for Astrophysics in Cambridge, MA; Tracy Clarke of the Naval Research Laboratory in Washington DC; Craig Sarazin of the University of Virginia in Charlottesville, VA; Brian McNamara of the University of Waterloo in Waterloo, Canada; Edmund Douglass of Boston University and Michael McDonald of the University of Maryland, College Park, MD.

This type of sloshing in Abell 2052 has important physical implications. First, it helps push some of the more dense, cooler gas located in the center of the cluster -- where temperatures are only about 10 million degrees -- farther away from the core. This helps prevent further cooling of this gas in the core and could limit the amount of new stars being formed in the central galaxy. Sloshing motions like those seen in Abell 2052 also redistribute heavy elements, like iron and oxygen, which are forged in supernova explosions. These elements are used in the future generations of stars and planets and are necessary for life as we know it.

Chandra's observation of Abell 2052 was particularly long, lasting more than a week. Such a deep observation was necessary to detect all of the details in this image. Even then, processing to emphasize more subtle features was necessary to reveal the outer spiral structure.

In addition to the large-scale spiral feature, the deep Chandra observation reveals exquisite detail in the cluster center related to outbursts from the central supermassive black hole. The Chandra data show clear bubbles evacuated by material blasted away from the black hole, which are surrounded by dense, bright, cool rims. As with the sloshing, this activity helps prevent cooling of the gas in the cluster's core, setting limits on the growth of the giant elliptical galaxy and its supermassive black hole.

These results were published in the August 20, 2011 issue of The Astrophysical Journal. The authors were Elizabeth Blanton of Boston University, Boston, MA; Scott Randall of the Harvard-Smithsonian Center for Astrophysics in Cambridge, MA; Tracy Clarke of the Naval Research Laboratory in Washington DC; Craig Sarazin of the University of Virginia in Charlottesville, VA; Brian McNamara of the University of Waterloo in Waterloo, Canada; Edmund Douglass of Boston University and Michael McDonald of the University of Maryland, College Park, MD.

Fast Facts for Abell 2052:


Scale: Image is 9.3 arcmin across (about 1.27 million light years)
Category: Groups & Clusters of Galaxies
Coordinates: (J2000) RA 15h 16m 44.40s | Dec +07° 01' 20.00"
Constellation: Serpens
Observation Date: 11 pointings between Sept 2000 and June 2009
Observation Time: 183 hours 53 min (7 days 15 hours 53 min).
Obs. ID: 890, 5807, 10477-10480, 10879, 10914-10917
Color Code: X-ray (Blue); Optical (Orange)
Instrument: ACIS
References: Blanton, E. et al, 2011, ApJ 737:99
Distance Estimate: About 480 million light years (z=0.03549)
More aboutAbell 2052: A Galaxy Cluster Gets Sloshed